
Send FortiGate Logs to a Syslog Server or FortiAnalyzer
Before you run this
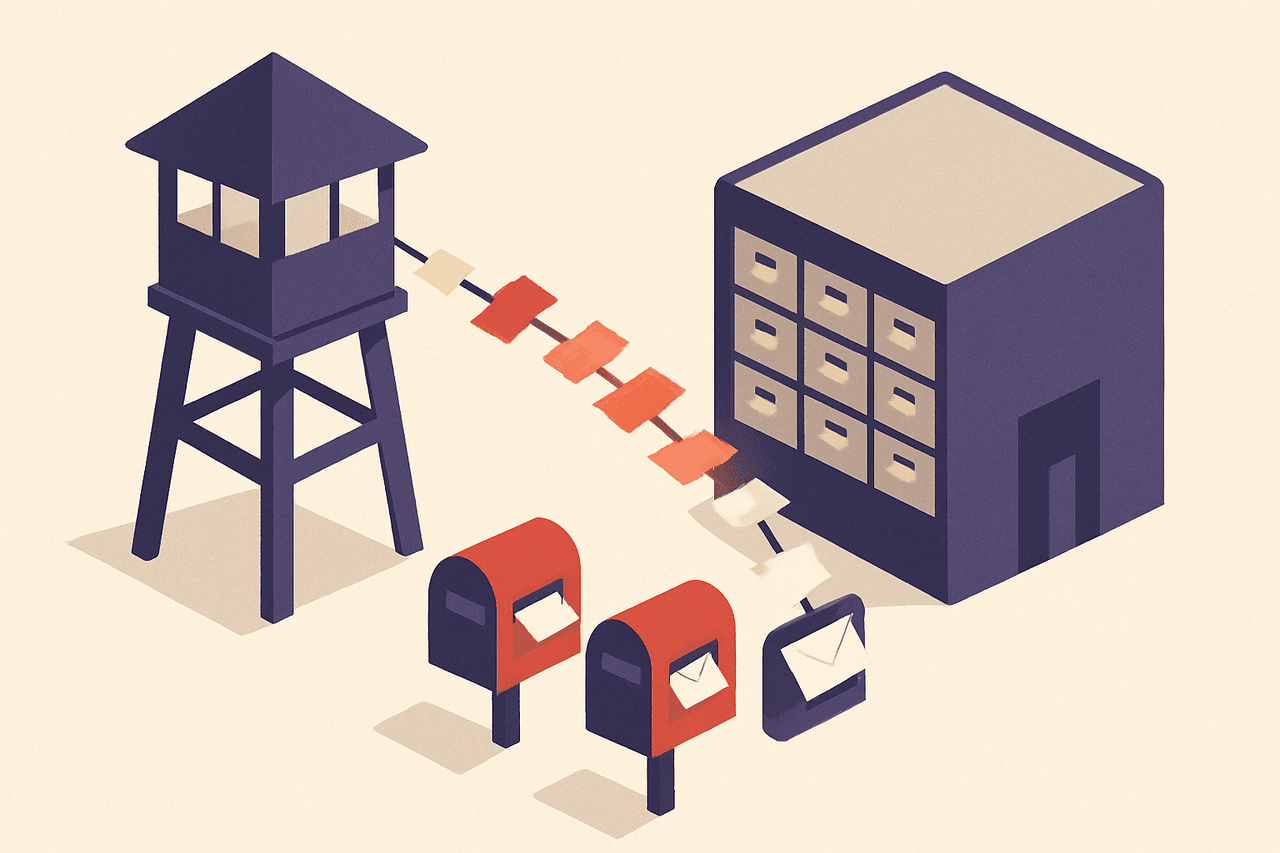
This guide configures a FortiGate to forward its logs to an external syslog server and/or a FortiAnalyzer. The purpose is centralized retention and search — logs live off the box, survive a reboot or an RMA, and can be correlated across devices.
What it changes: it adds a remote log target and a filter, and (importantly) it requires logging to be enabled on your firewall policies so traffic logs are actually generated. Adding a log destination does not delete anything and is easily reversed. The real risk is operational, not data loss: reliable/TCP syslog to an unreachable server, or turning on logtraffic all across a busy firewall, can spike CPU, memory, and disk, and in extreme cases affect throughput. Treat it as a real change.
Privileges: you need an administrator account with write access to system configuration (a super_admin profile, or a custom profile with system settings write permission). You will work over SSH or the console, or in the web GUI.
Because this is a firewall, do these first — not optionally:
- Keep a separate console or out-of-band connection open while you work. A logging change is unlikely to lock you out, but any live config session on a production firewall deserves a fallback.
- Back up the running configuration before you touch anything. In the GUI: the config/backup control in the admin dropdown (top right). From the CLI you can run
execute backup config— checkexecute backup config ?for the exact transport arguments (tftp, ftp, usb) available in your build rather than guessing them. - Make the change in a maintenance window if this is a busy edge device, because enabling per-policy logging changes disk and CPU load.
- Rollback path: restore the backup you just took (System > Configuration > Revisions if revision control is enabled, or
execute restore config …). The individual settings here are also trivially undone — see Undo at the end.
Test first. If you have a lab FortiGate or a VM (FortiGate-VM), apply and validate there before your production edge. Read each command before you paste it.
Assumptions for this guide: FortiOS 7.4, CLI access via SSH or console, and a reachable syslog collector or FortiAnalyzer on your management network. Menu labels and a few CLI defaults move between major versions, so if you are on 7.0, 7.2, or 6.4, confirm anything that looks different against the FortiOS Administration Guide for your version.
Option A — Send logs to a syslog server (CLI)
The CLI is the reliable path for syslog on FortiGate; not every field is exposed in the GUI. Replace 192.0.2.50 with your collector's IP.
config log syslogd setting
    set status enable
    set server "192.0.2.50"        # your syslog collector IP
    set port 514                   # 514 is the default; match your collector
    set mode udp                   # udp is standard; reliable = TCP
    set facility local7            # syslog facility label
    set format default             # or csv / cef / rfc5424
end
A note on mode: udp is fire-and-forget and the common default. reliable uses TCP and will retry — which is exactly why an unreachable TCP target can back up and hurt the box. Start with udp unless your collector requires TCP.
If your FortiGate has multiple interfaces and the logs should egress from a specific source, set a source IP. Confirm the keyword in your build (set source-ip under this same table) before relying on it:
config log syslogd setting
    set source-ip 10.10.10.1       # optional: interface IP logs are sent from
end
Filter what gets sent
Control severity and categories so you are not shipping debug noise:
config log syslogd filter
    set severity information        # send this level and more severe
end
The filter table has more toggles (forward traffic, local traffic, event subtypes). Run config log syslogd filter then set ? to see exactly what your firmware offers rather than assuming a keyword.
Multiple syslog servers: FortiOS supports additional independent targets under config log syslogd2 setting, syslogd3, and syslogd4, each with its own filter table. The syntax is identical to the block above.
Option B — Send logs to FortiAnalyzer (CLI)
FortiAnalyzer uses FortiGate's OFTP protocol, not syslog. Replace 192.0.2.60 with your FortiAnalyzer IP.
config log fortianalyzer setting
    set status enable
    set server "192.0.2.60"        # FortiAnalyzer IP
    set upload-option realtime      # realtime / 1-minute / 5-minute
    set reliable enable             # OFTP over TCP for guaranteed delivery
end
There is a matching filter table:
config log fortianalyzer filter
    set severity information
end
Two-step registration. Enabling the setting on the FortiGate only announces the device. You must then authorize the FortiGate on the FortiAnalyzer side, under Device Manager, where it appears as an unregistered/unauthorized device. Until you authorize it there, logs will not be accepted. Follow the FortiAnalyzer Administration Guide for the exact Device Manager steps for your FAZ version.
Encryption (enc-algorithm) and certificate settings exist under this same table if you require encrypted log transport; check the admin guide for the current keywords before enabling them in production.
The step people forget: enable logging on your policies
A remote target only forwards logs that the FortiGate actually generates. Traffic logs are generated per firewall policy. If your policies don't log, your shiny new syslog server stays quiet.
For a specific policy (find its ID under config firewall policy, show):
config firewall policy
    edit 5                          # the policy ID you want to log
        set logtraffic all          # all sessions; or "utm" for security events only
    next
end
all logs every session (start/end); utm logs only sessions that trigger a security profile. On a busy internet edge, all is a lot of volume — decide deliberately.
Doing it in the GUI
If you prefer the web UI on FortiOS 7.4, the remote logging targets live on the Log Settings page under the Log & Report section. There you can toggle FortiAnalyzer and Syslog and enter the server address. Per-policy logging is set on each policy under Policy & Objects > Firewall Policy, in the Logging Options of the policy editor. If a specific control isn't present in the GUI on your build, it exists in the CLI blocks above — the GUI is a subset. Because the exact page label shifted across 7.x releases, confirm the menu location in the FortiOS 7.4 Administration Guide if it isn't where you expect.
Verify it worked
Generate test log traffic from the FortiGate:
diagnose log test
This emits sample log entries of several types — useful to confirm the pipe end to end.
For FortiAnalyzer, test the connection directly:
execute log fortianalyzer test-connectivity
This reports registration and connectivity status to the FAZ.
For syslog, watch the packets actually leave the box (adjust the port if you changed it):
diagnose sniffer packet any 'udp and port 514' 4
You should see UDP 514 packets heading to your collector's IP. Press Ctrl+C to stop. If you see nothing, check the source interface has a route to the collector and that no policy blocks the egress.
Finally, confirm on the receiving side: search your syslog collector (or FortiAnalyzer's Log View) for entries from this FortiGate's serial number or IP within the last minute.
Undo / roll back
Everything here is reversible.
Disable a syslog target without deleting its settings:
config log syslogd setting
    set status disable
end
Disable FortiAnalyzer logging the same way:
config log fortianalyzer setting
    set status disable
end
Turn logging back off on a policy:
config firewall policy
    edit 5
        set logtraffic disable
    next
end
If anything looks wrong at a broader level, restore the configuration backup you took in Before you run this — that returns the device to its exact pre-change state.
For field-level questions — a keyword that differs on your firmware, or the FortiAnalyzer Device Manager authorization flow — consult the FortiOS 7.4 Administration Guide and the FortiAnalyzer Administration Guide on the Fortinet Document Library rather than guessing at syntax on a live edge device.
Runs enterprise networks and security for a living, and writes Shore Up to turn two decades of hands-on Linux, Windows and mail-server work into guides you can actually use.
More about the author →Was this article helpful?
Tap a star — no sign-in needed.
Be the first to rate this article.
Related guides
Recover Admin Access to a Locked-Out FortiGate
This procedure recovers administrative access to a FortiGate when you have lost or forgotten the admin password. It uses FortiOS's built-in maintainer account, which lets you log in over the serial console immediately after a hard power cycle and reset the administrator password. That is the only thing it changes: one admin account's password. It does not erase your configuration.

Configure Web Filtering and Application Control on a FortiGate
This guide adds two FortiGuard security profiles — Web Filter and Application Control — to an existing firewall policy so the FortiGate inspects outbound traffic and blocks the categories and applications you choose. It's how you stop users reaching malware and phishing sites, or using peer-to-peer and proxy apps, on the way out to the internet.

Upgrade FortiGate Firmware Without Losing Connectivity
This guide walks a standalone FortiGate through a firmware upgrade — checking the supported upgrade path, backing up config, flashing the new image, and verifying it — with the least possible disruption. A firmware upgrade reboots the unit . On a single (non-HA) FortiGate there is no way to avoid a short traffic outage during that reboot; "without losing connectivity" here means without locking yourself out and without losing your configuration , not zero downtime. Only an HA pair gives you a near-seamless upgrade, and that is a different procedure (noted at the end).

Back Up and Restore a FortiGate Configuration the Safe Way
This guide backs up a FortiGate's running configuration to a file you can store off-box, and restores that file when you need to roll back or rebuild. A backup is harmless. A restore is not: restoring a full configuration overwrites everything on the unit and reboots it. If the file is for a different model or firmware, or was captured with private-data encryption you can't unlock, the restore can leave the box unreachable.